library(openxlsx)
library(here)Converting Excel Data to Time Series in R
Introduction
In this tutorial, we’ll demonstrate how to import exchange rate data from an Excel file into R and convert it into a time series format.
Preparing the Excel File
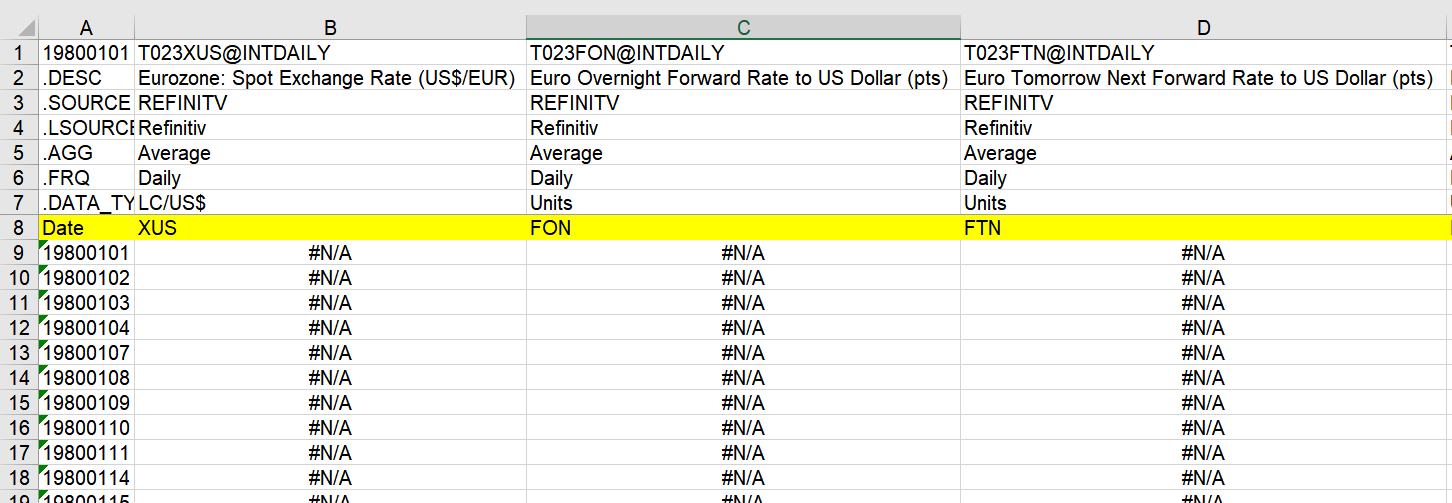
We will use the databases/Haver_Forward_Rates.xlsx file, which contains daily spot and forward exchange rates from Haver Analytics.

The variable names we are going to use are in row 8. Here’s what each variable represents:
- Date: The date of the exchange rate observation.
- XUS: The exchange rate vis-a-vis the US dollar.
- FON: The overnight forward premium.
- FTN: The forward premium for the next day.
- F1W: The forward premium for one week.
- F1M: The forward premium for one month.
- F2M: The forward premium for two months.
Reading the Excel File into R
To start, we’ll load the necessary libraries:
With our libraries loaded, we can read in the data from the specified path, ensuring we skip the first seven rows which don’t contain the data we need:
euro <- read.xlsx(xlsxFile = here("databases/Haver_Forward_Rates.xlsx"),
                  sheet = "Euro",
                  startRow = 8,
                  detectDates = TRUE)
Checking the Data Import
Let’s verify that the import was successful by viewing the last few rows of the dataset:
tail(euro) Date XUS FON FTN F1W F1M F2M F3M F6M F9M
11219 20221230 1.0702 3e-04 1e-04 5e-04 0.0023 0.0043 0.0066 0.0119 0.0166
11220 20230102 1.0662 0e+00 1e-04 5e-04 0.0025 0.0045 0.0067 0.0122 0.0170
11221 20230103 1.0546 1e-04 1e-04 5e-04 0.0024 0.0043 0.0065 0.0119 0.0166
11222 20230104 1.0599 1e-04 1e-04 5e-04 0.0023 0.0043 0.0065 0.0120 0.0167
11223 20230105 1.0520 1e-04 1e-04 6e-04 0.0023 0.0043 0.0065 0.0120 0.0169
11224 20230106 1.0644 2e-04 1e-04 5e-04 0.0023 0.0043 0.0064 0.0118 0.0168
F1 F2 F3 F4 F5
11219 0.0201 0.0322 0.0393 0.0459 0.0524
11220 0.0211 0.0319 0.0406 0.0496 0.0593
11221 0.0212 0.0317 0.0387 0.0470 0.0546
11222 0.0216 0.0328 0.0407 0.0497 0.0578
11223 0.0219 0.0339 0.0416 0.0506 0.0579
11224 0.0213 0.0315 0.0378 0.0452 0.0519Next, we check the structure of the data to ensure R has correctly identified the types of each column:
str(euro)'data.frame': 11224 obs. of 15 variables:
$ Date: chr "19800101" "19800102" "19800103" "19800104" ...
$ XUS : num NA NA NA NA NA NA NA NA NA NA ...
$ FON : num NA NA NA NA NA NA NA NA NA NA ...
$ FTN : num NA NA NA NA NA NA NA NA NA NA ...
$ F1W : num NA NA NA NA NA NA NA NA NA NA ...
$ F1M : num NA NA NA NA NA NA NA NA NA NA ...
$ F2M : num NA NA NA NA NA NA NA NA NA NA ...
$ F3M : num NA NA NA NA NA NA NA NA NA NA ...
$ F6M : num NA NA NA NA NA NA NA NA NA NA ...
$ F9M : num NA NA NA NA NA NA NA NA NA NA ...
$ F1 : num NA NA NA NA NA NA NA NA NA NA ...
$ F2 : num NA NA NA NA NA NA NA NA NA NA ...
$ F3 : num NA NA NA NA NA NA NA NA NA NA ...
$ F4 : num NA NA NA NA NA NA NA NA NA NA ...
$ F5 : num NA NA NA NA NA NA NA NA NA NA ...Converting the Date Format
We see that the Date variable has been imported as a string. We need to convert this to a Date object. We will do this using the parse_date function from the readr library:
library(readr)
euro$Date <- parse_date(euro$Date, "%Y%m%d")
tail(euro)
Date XUS FON FTN F1W F1M F2M F3M F6M F9M
11219 2022-12-30 1.0702 3e-04 1e-04 5e-04 0.0023 0.0043 0.0066 0.0119 0.0166
11220 2023-01-02 1.0662 0e+00 1e-04 5e-04 0.0025 0.0045 0.0067 0.0122 0.0170
11221 2023-01-03 1.0546 1e-04 1e-04 5e-04 0.0024 0.0043 0.0065 0.0119 0.0166
11222 2023-01-04 1.0599 1e-04 1e-04 5e-04 0.0023 0.0043 0.0065 0.0120 0.0167
11223 2023-01-05 1.0520 1e-04 1e-04 6e-04 0.0023 0.0043 0.0065 0.0120 0.0169
11224 2023-01-06 1.0644 2e-04 1e-04 5e-04 0.0023 0.0043 0.0064 0.0118 0.0168
F1 F2 F3 F4 F5
11219 0.0201 0.0322 0.0393 0.0459 0.0524
11220 0.0211 0.0319 0.0406 0.0496 0.0593
11221 0.0212 0.0317 0.0387 0.0470 0.0546
11222 0.0216 0.0328 0.0407 0.0497 0.0578
11223 0.0219 0.0339 0.0416 0.0506 0.0579
11224 0.0213 0.0315 0.0378 0.0452 0.0519Converting to XTS for Time Series Analysis
For the actual time series analysis, we use the xts package:
library(xts)Now we are going to convert the data. The data consists of all the columns except the first, and the dates are in the first column:
euro <- as.xts(x = euro[,-1], order.by = euro[,1])
tail(euro)
XUS FON FTN F1W F1M F2M F3M F6M F9M F1
2022-12-30 1.0702 3e-04 1e-04 5e-04 0.0023 0.0043 0.0066 0.0119 0.0166 0.0201
2023-01-02 1.0662 0e+00 1e-04 5e-04 0.0025 0.0045 0.0067 0.0122 0.0170 0.0211
2023-01-03 1.0546 1e-04 1e-04 5e-04 0.0024 0.0043 0.0065 0.0119 0.0166 0.0212
2023-01-04 1.0599 1e-04 1e-04 5e-04 0.0023 0.0043 0.0065 0.0120 0.0167 0.0216
2023-01-05 1.0520 1e-04 1e-04 6e-04 0.0023 0.0043 0.0065 0.0120 0.0169 0.0219
2023-01-06 1.0644 2e-04 1e-04 5e-04 0.0023 0.0043 0.0064 0.0118 0.0168 0.0213
F2 F3 F4 F5
2022-12-30 0.0322 0.0393 0.0459 0.0524
2023-01-02 0.0319 0.0406 0.0496 0.0593
2023-01-03 0.0317 0.0387 0.0470 0.0546
2023-01-04 0.0328 0.0407 0.0497 0.0578
2023-01-05 0.0339 0.0416 0.0506 0.0579
2023-01-06 0.0315 0.0378 0.0452 0.0519Visualizing the Time Series Data
To visualize the exchange rates, we use the zoo package:
library(zoo)
plot.zoo(euro$XUS)
To focus on data starting from a particular year, such as 2010:
plot.zoo(euro$XUS["2010-01-01/"], xlab = "", ylab = "", main = "Euro-dollar exchange rate", las = 1)